Framework Overview
Workflow Summary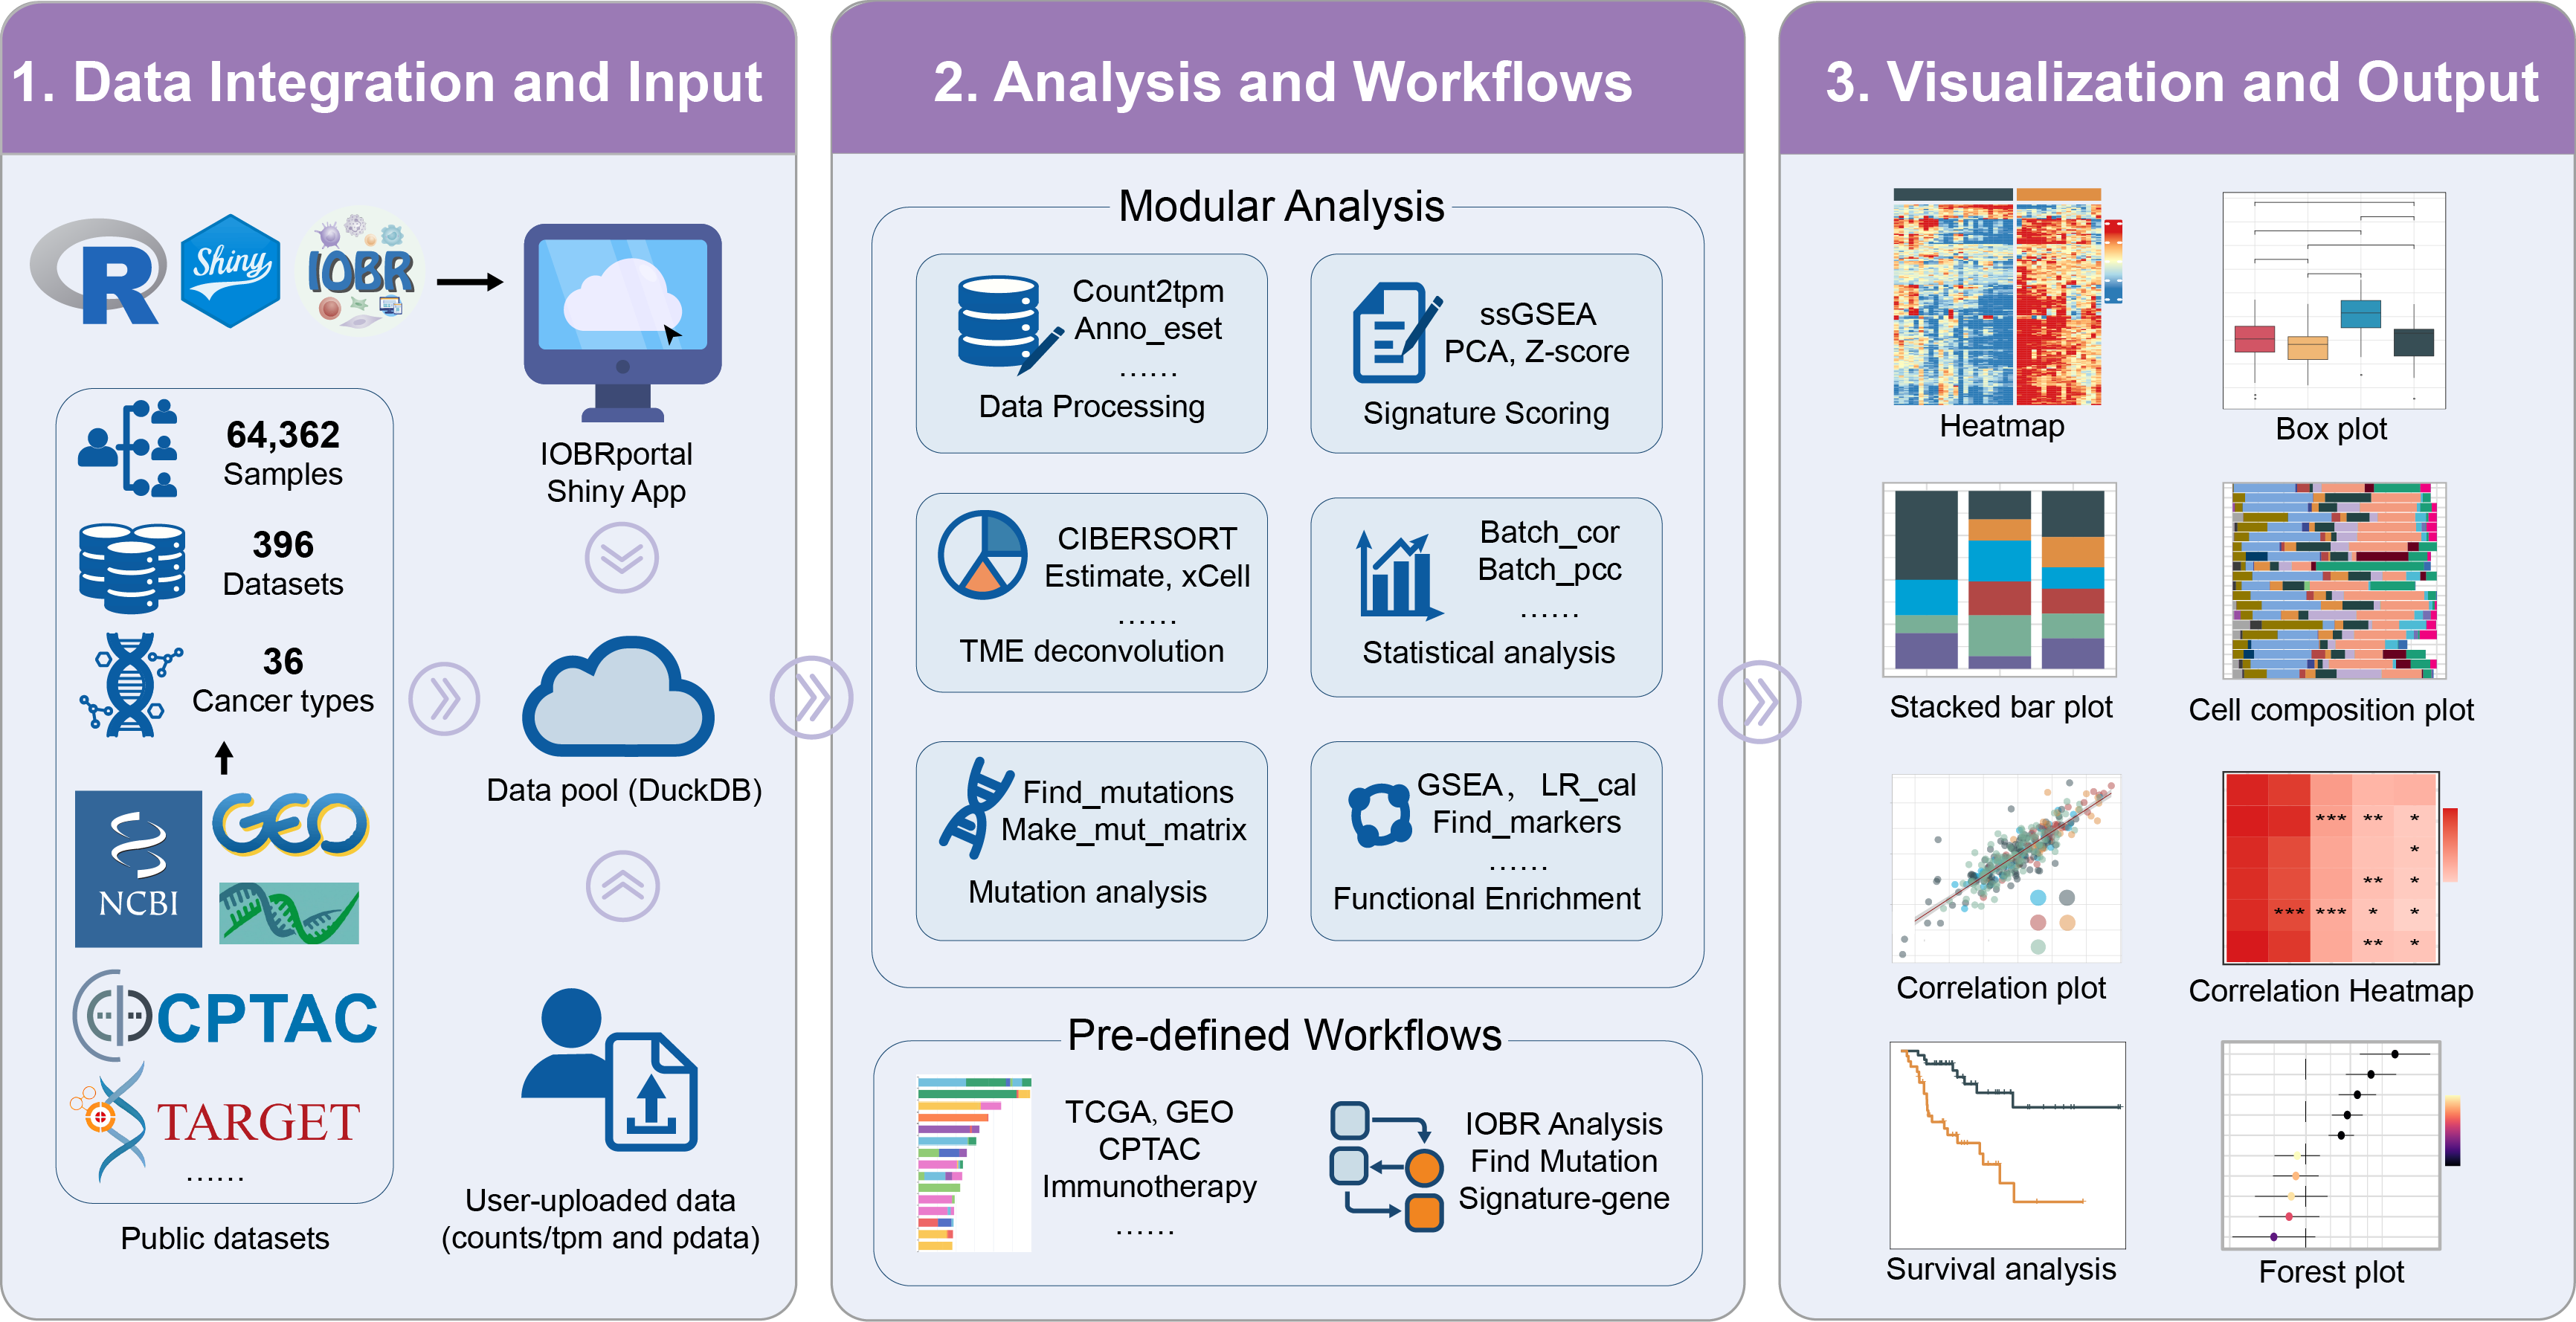
Explore modular tools and pre-defined workflows for end-to-end TME and immuno-oncology analyses. IOBRportal provides an integrated interface for transcriptome preprocessing, signature scoring, TME deconvolution, statistical analysis, and visualization.
The portal provides both function-oriented tools and workflow-oriented analysis routes, allowing users to start from individual tasks or follow guided pipelines for end-to-end interpretation in a unified and reproducible interface.
It is designed for both pre-integrated public cohorts and user-uploaded datasets. For dataset scale, cohort composition, and distribution statistics, please refer to Workflows → Datasets → Overview.
Total Samples
Datasets
Cancer Types
Data Sections
Count2tpm : Converts raw gene counts to TPM.
Parameter
Data Download
Plot and Data
Anno_eset : Annotates an ExpressionSet with gene symbols.
Parameter
Data Download
Plot and Data
Remove_duplicate_genes : Aggregate duplicate gene symbols using Mean, SD, or Sum.
Parameter
Data Download
Result Data
Find_outlier_samples : Identify and remove outlier samples.
Parameter
Data Download
Plot and Data
Remove_batcheffect : Integrate and correct batch effects from multiple datasets.
Parameter
Data Download
Plot and Data
Mouse2human_eset : Convert mouse gene symbols in an expression set to human homologs.
Parameter
The parameter must be specified if 'Matrix' is FALSE.
Data Download
Result Data
Calculate_sig_score : Computes signature scores using PCA, ssGSEA, z-score, or integration.
Parameter
Data Download
Plot and Data
Deconvo_tme : Performs immune deconvolution using multiple algorithms.
Parameter
Note: CIBERSORT will take a long time.
Note: Parallel can accelerate the calculation.
Note: This pipeline runs ALL algorithms and calculates signatures. It may take a while.
Data Download
Plot and Data
Tme_cluster : Performs tumor microenvironment clustering analysis.
Parameter
Optional: select interesting features for TME clustering; leave empty to skip this step.
Data Download
Plot and Data
LR_cal : Quantifies ligand-receptor interactions in the tumor microenvironment.
Parameter
Note: LR_cal will take a long time.
Data Download
Plot and Data
Batch_surv : Runs survival Cox analysis for multiple features.
Parameter
Data Download
Plot and Data
Batch_cor : Calculates Pearson or Spearman correlations across multiple feature pairs.
Parameter
Data Download
Plot and Data
Batch_pcc : Computes partial correlations while adjusting for a third variable.
Parameter
Data Download
Plot and Data
Batch_wilcoxon : Runs Wilcoxon rank-sum tests on multiple features (for two groups).
Parameter
Data Download
Plot and Data
batch_kruskal : Runs Kruskal–Wallis tests on multiple features (for three or more groups).
Parameter
Data Download
Plot and Data
Sig_heatmap : Draws customizable heatmaps grouped by annotations or conditions.
Parameter
Input hex codes or color names separated by comma. If filled, 'Palette Group' will be ignored.
Provide at least 3 colors separated by comma. Used for heatmap low-mid-high values.
Plot
Sig_box : Creates customizable boxplots for signatures or variables.
Parameter
Input hex codes or color names separated by comma. If filled, 'Palette' will be ignored.
Plot and Data
Sig_surv_plot : Generates multiple KM survival curves for genes or signatures.
Parameter
Input hex codes or color names separated by comma. If filled, 'Palette' will be ignored.
Plot and Data
Roc_time : Generates time-dependent ROC curves with AUC values.
Parameter
Input hex codes or color names separated by comma. If filled, 'Palette' will be ignored.
Plot and Data
Sig_forest : Produces forest plots from batch survival results.
Parameter
Note: Supports data from Signature Data rather than TME data.
Input hex codes or color names separated by comma. If filled, 'Palette' will be ignored.
Plot and Data
Get_cor : Computes and plots correlation between two variables with regression options.
Parameter
Input hex codes or color names separated by comma. If you have group like subtype.
Plot and Data
Get_cor_matrix : Calculates and displays a correlation matrix for variable groups.
Parameter
Provide 2 or 3 colors separated by comma. 2 colors = low/high (mid=white); 3 colors = low/mid/high.
Plot and Data
IOBR_pca : Perform Principal Component Analysis (PCA).
Parameter
Input hex codes or color names separated by comma. If filled, 'Palette' will be ignored.
Plot Result
Cell_bar_plot : Visualizes cell composition or immune infiltration profiles across samples.
Parameter
Note: Supports data from deconvolution methods such as CIBERSORT, EPIC, and quanTIseq.
Input hex codes or color names separated by comma.
Plot and Data
Surv_group : Generates Kaplan-Meier survival plots for categorical grouping variables.
Parameter
Input hex codes or color names separated by comma. If filled, 'Palette' will be ignored.
Plot and Data
Sig_roc : Generates ROC curves for significant signatures.
Parameter
Input hex codes or color names separated by comma. If filled, 'Palette' will be ignored.
Plot and Data
Percent_bar_plot : Plots percentage bar charts for categorical variables.
Parameter
Input hex codes or color names separated by comma. If filled, 'Palette' will be ignored.
Plot and Data
Sig_gsea : Performs GSEA analysis based on differential expression results.
Parameter for data
DESeq2 uses raw counts and Limma uses log2-transformed TPM values.
Parameter for plot
Input hex codes or color names separated by comma.
Data Download
Plot and Data
Find_markers_in_bulk : Identifies marker genes for each group using Seurat workflow on bulk data.
Parameter for data
Input hex codes or color names separated by comma. If filled, 'Group Color' will be ignored.
Input hex codes or color names separated by comma. If filled, 'Heatmap Color' will be ignored.
Data Download
Plot and Data
Make_mut_matrix : Converts MAF mutation data into a binary mutation matrix.
Parameter
Data Download
Plot and Data
Find_mutations : Identifies phenotype-associated mutations.
Parameter
Note: Signature scores can be calculated using the IOBR Workflow then uploaded here.
Parameter for oncoprint
Input a hex code or color name for mutation events.
Parameter for box plot
Input hex codes or color names separated by comma. If filled, 'Palette' will be ignored.
All Results Download
Plot and Data
Mutation Workflow : Mutation Matrix Construction, Mutation–Signature Analysis, and Survival Analysis.
Parameter
Data Download
Plot and Data
Parameter
Note: Signature scores can be calculated using the IOBR Workflow then uploaded here.
Parameter for oncoprint
Input a hex code or color name for mutation events.
Parameter for box plot
Input hex codes or color names separated by comma. If filled, 'Palette' will be ignored.
All Results Download
Plot and Data
Parameter
Data Download
Plot and Data
Parameter
Data Download
Plot and Data
Parameter
Input hex codes or color names separated by comma. If filled, 'Palette' will be ignored.
Plot and Data
IOBR Workflow : Integrated Pipeline for Signature Scoring, TME Deconvolution, and Downstream Analysis.
Parameter
Data Download
Plot and Data
Parameter
Data Download
Plot and Data
Parameter
Note: It is optional and defaults to True.
Data Download
Plot and Data
Parameter
Data Download
Plot and Data
Parameter
Note: CIBERSORT will take a long time.
Note: Parallel can accelerate the calculation.
Note: This pipeline runs ALL algorithms and calculates signatures. It may take a while.
Data Download
Plot and Data
Parameter
Optional: select interesting features for TME clustering; leave empty to skip this step.
Data Download
Plot and Data
Parameter
Data Download
Combined Data Preview
Parameter
Input hex codes or color names separated by comma. If filled, 'Palette Group' will be ignored.
Provide at least 3 colors separated by comma. Used for heatmap low-mid-high values.
Plot
Parameter
Input hex codes or color names separated by comma. If filled, 'Palette' will be ignored.
Plot and Data
Parameter
Input hex codes or color names separated by comma. If filled, 'Palette' will be ignored.
Plot and Data
Parameter
Note: Supports data from deconvolution methods such as CIBERSORT, EPIC, and quanTIseq.
Input hex codes or color names separated by comma.
Plot and Data
Parameter
Data Download
Plot and Data
Parameter
Data Download
Plot and Data
Parameter
The signatures will be auto-selected
Input hex codes or color names separated by comma. If filled, 'Palette Group' will be ignored.
Provide at least 3 colors separated by comma. Used for heatmap low-mid-high values.
Plot
Parameter
Input hex codes or color names separated by comma. If filled, 'Palette' will be ignored.
Plot and Data
Parameter
Data Download
Plot and Data
Parameter
Note: Supports data from Signature Data rather than TME data.
Input hex codes or color names separated by comma. If filled, 'Palette' will be ignored.
Plot and Data
Parameter
The signatures will be auto-selected
Input hex codes or color names separated by comma. If filled, 'Palette Group' will be ignored.
Provide at least 3 colors separated by comma. Used for heatmap low-mid-high values.
Plot
Parameter
Input hex codes or color names separated by comma. If filled, 'Palette' will be ignored.
Plot and Data
Parameter
Input hex codes or color names separated by comma. If filled, 'Palette' will be ignored.
Plot and Data
Parameter
Input hex codes or color names separated by comma. If filled, 'Palette' will be ignored.
Plot and Data
Parameter
Input hex codes or color names separated by comma. If filled, 'Palette' will be ignored.
Plot and Data
Parameter
Data Download
Plot and Data
Parameter
Data Download
Plot and Data
Parameter
Input hex codes or color names separated by comma. If you have group like subtype.
Plot and Data
Parameter
Provide 2 or 3 colors separated by comma. 2 colors = low/high (mid=white); 3 colors = low/mid/high.
Plot and Data
Signature-Gene Workflow : Explore relationships between specific signatures and genes.
Parameter
Data Download
Plot and Data
Parameter
Data Download
Plot and Data
Parameter
Data Download
Plot and Data
Parameter
Data Download
Plot and Data
Parameter
Data Download
Plot and Data
Parameter
Input hex codes or color names separated by comma. If you have group like subtype.
Plot and Data
Parameter
Provide 2 or 3 colors separated by comma. 2 colors = low/high (mid=white); 3 colors = low/mid/high.
Plot and Data
IOBRportal Database Statistics
The IOBRportal integrates multi-omics data from four major cohorts: TCGA Cohort, MOLC (Molecular Cohort) (predominantly GEO), IMMC (Immunotherapy Cohort), and CLIC (Clinical Cohort) (including CPTAC and TARGET). The data is structured into two primary analysis modes—Calculate Sigscore and Deconvolute TME features—designed to facilitate comprehensive downstream bioinformatics analyses.Database Overview
Cancer Types Distribution
Detailed Cohort Metadata
Quick Analysis Access
Select a cohort to start your analysis workflow immediately:
Choose Data Source
Method Parameters
Plot and Data
Choose Data Source
Method Parameters
Plot and Data
Choose Data Source
Method Parameters
Plot and Data
Choose Data Source
Method Parameters
Plot and Data
TCGA Cohorts Workflow : Database-driven Pipeline for Signature Scoring, TME Deconvolution, and Downstream Analysis.
Choose Data Source
Method Parameters
Plot and Data
Parameter
Optional: select interesting features for TME clustering; leave empty to skip this step.
Data Download
Plot and Data
Parameter
Input hex codes or color names separated by comma. If filled, 'Palette Group' will be ignored.
Provide at least 3 colors separated by comma. Used for heatmap low-mid-high values.
Plot
Parameter
Input hex codes or color names separated by comma. If filled, 'Palette' will be ignored.
Plot and Data
Parameter
Input hex codes or color names separated by comma. If filled, 'Palette' will be ignored.
Plot and Data
Parameter
Note: Supports data from deconvolution methods such as CIBERSORT, EPIC, and quanTIseq.
Input hex codes or color names separated by comma.
Plot and Data
Parameter
Data Download
Plot and Data
Parameter
Data Download
Plot and Data
Parameter
The signatures will be auto-selected
Input hex codes or color names separated by comma. If filled, 'Palette Group' will be ignored.
Provide at least 3 colors separated by comma. Used for heatmap low-mid-high values.
Plot
Parameter
Input hex codes or color names separated by comma. If filled, 'Palette' will be ignored.
Plot and Data
Parameter
Data Download
Plot and Data
Parameter
Note: Supports data from Signature Data rather than TME data.
Input hex codes or color names separated by comma. If filled, 'Palette' will be ignored.
Plot and Data
Parameter
The signatures will be auto-selected
Input hex codes or color names separated by comma. If filled, 'Palette Group' will be ignored.
Provide at least 3 colors separated by comma. Used for heatmap low-mid-high values.
Plot
Parameter
Input hex codes or color names separated by comma. If filled, 'Palette' will be ignored.
Plot and Data
Parameter
Input hex codes or color names separated by comma. If filled, 'Palette' will be ignored.
Plot and Data
Parameter
Input hex codes or color names separated by comma. If filled, 'Palette' will be ignored.
Plot and Data
Parameter
Input hex codes or color names separated by comma. If filled, 'Palette' will be ignored.
Plot and Data
Parameter
Data Download
Plot and Data
Parameter
Data Download
Plot and Data
Parameter
Input hex codes or color names separated by comma. If you have group like subtype.
Plot and Data
Parameter
Provide 2 or 3 colors separated by comma. 2 colors = low/high (mid=white); 3 colors = low/mid/high.
Plot and Data
TCGA Mutation Workflow : Database-driven Mutation–Signature and Survival Analysis.
Choose Data Source
Signature Data
Prepared Data
Parameter
Parameter for oncoprint
Input a hex code or color name for mutation events.
Parameter for box plot
Input hex codes or color names separated by comma. If filled, 'Palette' will be ignored.
All Results Download
Plot and Data
Parameter
Data Download
Plot and Data
Parameter
Input hex codes or color names separated by comma. If filled, 'Palette' will be ignored.
Plot and Data
CLIC Workflow : Database-driven Pipeline for Signature Scoring, TME Deconvolution, and Downstream Analysis.
Choose Data Source
Method Parameters
Plot and Data
Parameter
Optional: select interesting features for TME clustering; leave empty to skip this step.
Data Download
Plot and Data
Parameter
Input hex codes or color names separated by comma. If filled, 'Palette Group' will be ignored.
Provide at least 3 colors separated by comma. Used for heatmap low-mid-high values.
Plot
Parameter
Input hex codes or color names separated by comma. If filled, 'Palette' will be ignored.
Plot and Data
Parameter
Input hex codes or color names separated by comma. If filled, 'Palette' will be ignored.
Plot and Data
Parameter
Note: Supports data from deconvolution methods such as CIBERSORT, EPIC, and quanTIseq.
Input hex codes or color names separated by comma.
Plot and Data
Parameter
Data Download
Plot and Data
Parameter
Data Download
Plot and Data
Parameter
The signatures will be auto-selected
Input hex codes or color names separated by comma. If filled, 'Palette Group' will be ignored.
Provide at least 3 colors separated by comma. Used for heatmap low-mid-high values.
Plot
Parameter
Input hex codes or color names separated by comma. If filled, 'Palette' will be ignored.
Plot and Data
Parameter
Data Download
Plot and Data
Parameter
Note: Supports data from Signature Data rather than TME data.
Input hex codes or color names separated by comma. If filled, 'Palette' will be ignored.
Plot and Data
Parameter
The signatures will be auto-selected
Input hex codes or color names separated by comma. If filled, 'Palette Group' will be ignored.
Provide at least 3 colors separated by comma. Used for heatmap low-mid-high values.
Plot
Parameter
Input hex codes or color names separated by comma. If filled, 'Palette' will be ignored.
Plot and Data
Parameter
Input hex codes or color names separated by comma. If filled, 'Palette' will be ignored.
Plot and Data
Parameter
Input hex codes or color names separated by comma. If filled, 'Palette' will be ignored.
Plot and Data
Parameter
Input hex codes or color names separated by comma. If filled, 'Palette' will be ignored.
Plot and Data
Parameter
Data Download
Plot and Data
Parameter
Data Download
Plot and Data
Parameter
Input hex codes or color names separated by comma. If you have group like subtype.
Plot and Data
Parameter
Provide 2 or 3 colors separated by comma. 2 colors = low/high (mid=white); 3 colors = low/mid/high.
Plot and Data
IMMC Workflow : Database-driven Pipeline for Signature Scoring, TME Deconvolution, and Some Downstream Analysis.
Choose Data Source
Method Parameters
Plot and Data
Parameter
Optional: select interesting features for TME clustering; leave empty to skip this step.
Data Download
Plot and Data
Parameter
Input hex codes or color names separated by comma. If filled, 'Palette Group' will be ignored.
Provide at least 3 colors separated by comma. Used for heatmap low-mid-high values.
Plot
Parameter
Input hex codes or color names separated by comma. If filled, 'Palette' will be ignored.
Plot and Data
Parameter
Note: Supports data from deconvolution methods such as CIBERSORT, EPIC, and quanTIseq.
Input hex codes or color names separated by comma.
Plot and Data
Parameter
Data Download
Plot and Data
Parameter
Data Download
Plot and Data
Parameter
The signatures will be auto-selected
Input hex codes or color names separated by comma. If filled, 'Palette Group' will be ignored.
Provide at least 3 colors separated by comma. Used for heatmap low-mid-high values.
Plot
Parameter
Input hex codes or color names separated by comma. If filled, 'Palette' will be ignored.
Plot and Data
Parameter
Data Download
Plot and Data
Parameter
Data Download
Plot and Data
Parameter
Input hex codes or color names separated by comma. If you have group like subtype.
Plot and Data
Parameter
Provide 2 or 3 colors separated by comma. 2 colors = low/high (mid=white); 3 colors = low/mid/high.
Plot and Data
MOLC Workflow : Database-driven Pipeline for Signature Scoring, TME Deconvolution, and Some Downstream Analysis.
Choose Data Source
Method Parameters
Plot and Data
Parameter
Optional: select interesting features for TME clustering; leave empty to skip this step.
Data Download
Plot and Data
Parameter
Input hex codes or color names separated by comma. If filled, 'Palette Group' will be ignored.
Provide at least 3 colors separated by comma. Used for heatmap low-mid-high values.
Plot
Parameter
Input hex codes or color names separated by comma. If filled, 'Palette' will be ignored.
Plot and Data
Parameter
Note: Supports data from deconvolution methods such as CIBERSORT, EPIC, and quanTIseq.
Input hex codes or color names separated by comma.
Plot and Data
Parameter
Data Download
Plot and Data
Parameter
Data Download
Plot and Data
Parameter
The signatures will be auto-selected
Input hex codes or color names separated by comma. If filled, 'Palette Group' will be ignored.
Provide at least 3 colors separated by comma. Used for heatmap low-mid-high values.
Plot
Parameter
Input hex codes or color names separated by comma. If filled, 'Palette' will be ignored.
Plot and Data
Parameter
Data Download
Plot and Data
Parameter
Data Download
Plot and Data
Parameter
Input hex codes or color names separated by comma. If you have group like subtype.
Plot and Data
Parameter
Provide 2 or 3 colors separated by comma. 2 colors = low/high (mid=white); 3 colors = low/mid/high.