R语言基础
R语言在生物信息学中的应用
中南大学生物医学信息系
2026-03-19
课程大纲
本讲内容
- 数据科学与R语言
- R对象
- R向量
- R常见数据结构
- 运算符与向量运算
- R编程
- 函数及应用
- 取子集
第1部分:数据科学与R语言
1.1 什么是数据科学?
数据科学是利用编程、统计和专业知识从数据中提取价值的学科
数据科学三要素
- 🧮 编程:工具(R / Python)
- 📊 统计:灵魂
- 🔬 专业:核心(生物医学)
目的不是培养程序员,而是用数据推动学科发展
数据科学流程
- 数据导入
- 数据规整(清洗)
- 数据处理
- 可视化
- 建模
- 可重复性报告
1.2 R是什么?
1992年,新西兰奥克兰大学 Ross Ihaka 和 Robert Gentleman 开发了R语言
核心特点
- 📊 统计计算与图形可视化
- 💻 跨平台:Windows / Mac / Linux
- 💰 开源免费(GPL协议)
- 📦 丰富的包生态系统
- 👥 活跃的社区支持
R在生物医学中的应用
- 🧬 RNA-seq差异表达(DESeq2)
- 🔬 单细胞测序分析(Seurat)
- 📈 临床数据统计(survival)
- 🗺️ 基因组注释(GenomicRanges)
- 📝 可重复研究(R Markdown/Quarto)
1.3 R大神与tidyverse
Hadley Wickham

2019年荣获考普斯总统奖(统计学诺贝尔奖)
- 创建了 tidyverse 生态系统
- 彻底改变了现代R编程风格
- 著有 R for Data Science 等经典书籍
- 个人主页:https://hadley.nz/
tidyverse:数据科学全家桶
核心包:
dplyr— 数据处理ggplot2— 数据可视化tidyr— 数据整理readr— 数据读取stringr— 字符处理
tidyverse官网:https://www.tidyverse.org/
1.4 安装R和RStudio
安装步骤
① 安装R
- 官网:https://cran.r-project.org/
- 选择对应操作系统版本
- Windows/macOS/Linux均支持
② 安装RStudio
- 官网:https://posit.co/download/rstudio-desktop/
- 免费开源的集成开发环境
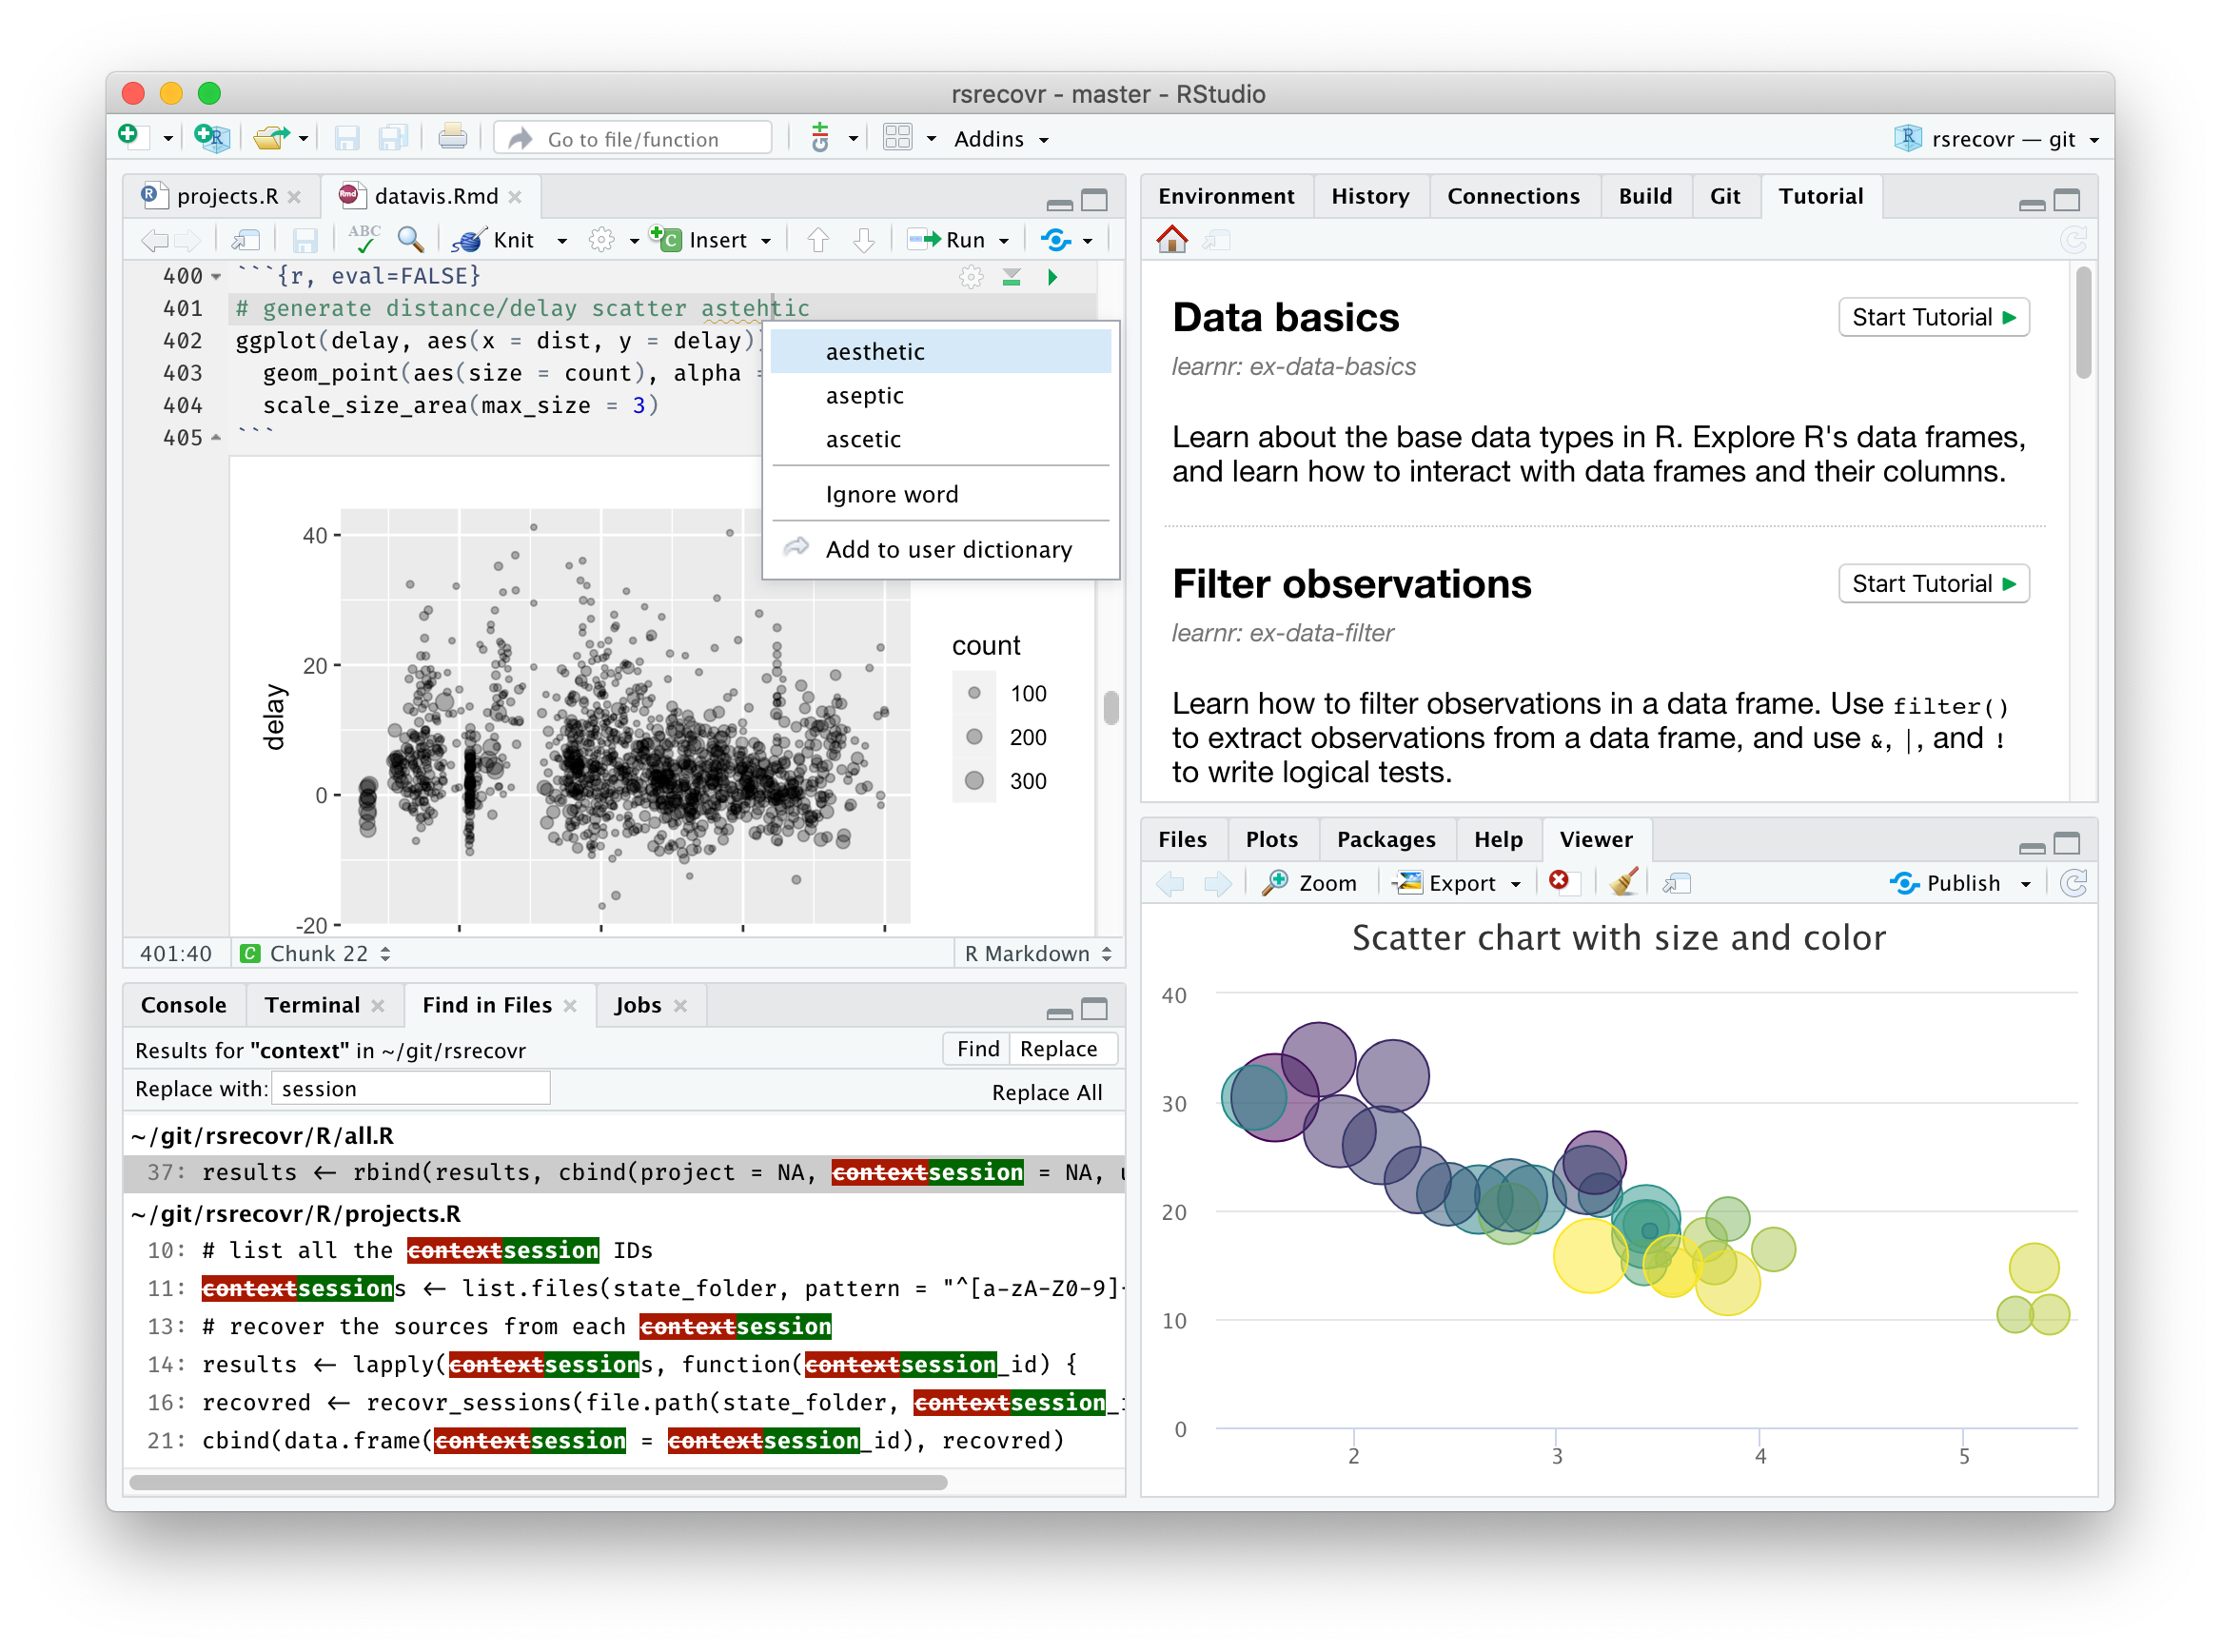
RStudio四大面板
┌──────────────┬──────────────┐
│    源代码    │    环境/历史  │
│  (脚本编辑)  │  (变量查看)  │
├──────────────┼──────────────┤
│    控制台    │  文件/图形/  │
│  (命令输入)  │  包/帮助     │
└──────────────┴──────────────┘
1.4 安装R和RStudio
RStudio
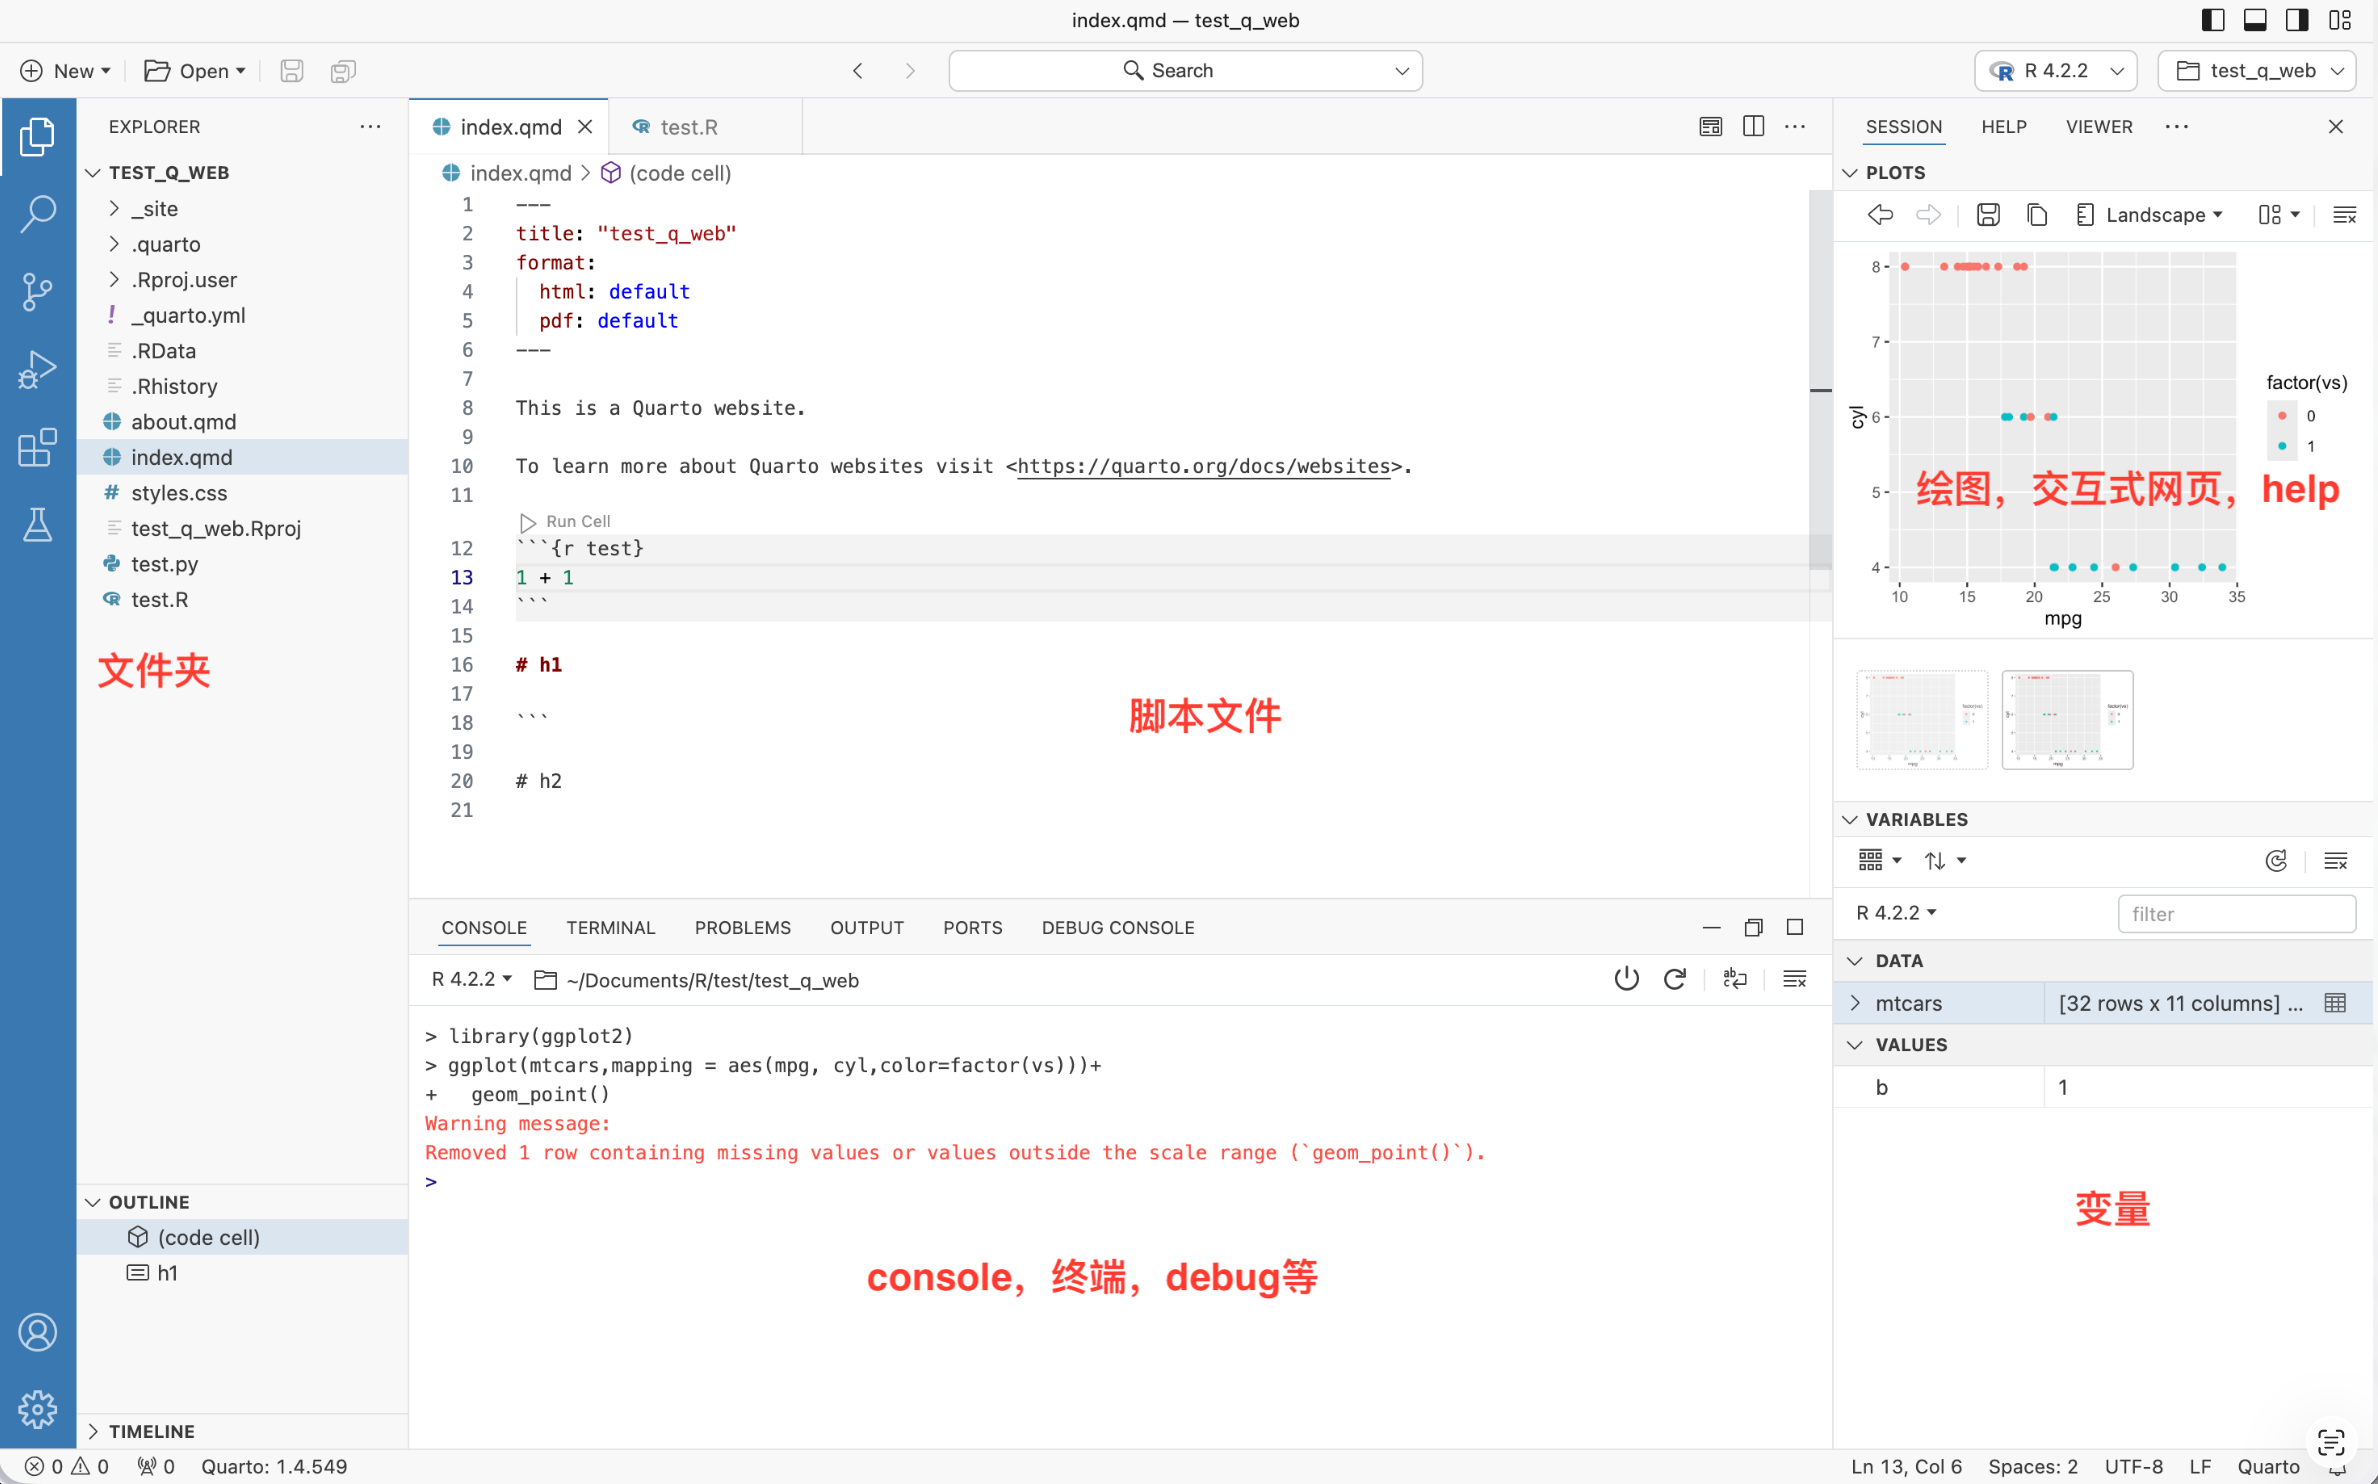
1.5 Positron - The Data Science IDE
第2部分:R对象
2.1 一切皆对象
在R中存储的数据称为对象(object),R语言数据处理就是不断创建和操控这些对象
R可以当计算器使用
2.1 一切皆对象
查看对象类型
2.2 对象的创建与赋值
使用赋值操作符
<-或=将数据赋值给变量
2.3 变量命名规则
2.4 对象属性
2.5 属性与赋值
第3部分:R向量
3.1 向量:R的核心数据结构
向量(vector)是R最基础的数据类型,元素类型统一,用
c()创建
创建向量
3.2 向量类型详解 - 数值型:integer vs double
3.2 向量类型详解 - 字符串型(String)
3.3 因子型向量(factor)
因子是带有层级(Levels)的字符串向量,用于表示分类变量
3.3 因子型向量(factor)
3.4 命名向量
3.5 强制类型转换
向量元素必须是同一类型,若类型不同,R自动转换(强制转换)
转换层级规则
character > numeric > logical
double > integer3.5 强制类型转换
3.5 强制类型转换
第4部分:R常见数据结构
4.1 基础数据结构概览
| 数据结构 | 维度 | 元素类型 | 适用场景 |
|---|---|---|---|
vector |
1维 | 统一 | 单列数据、序列 |
matrix |
2维 | 统一 | 基因表达矩阵 |
list |
任意 | 混合 | 分析结果集合 |
data.frame |
2维 | 混合 | 临床数据表格 |
💡 矩阵、列表、数据框都可以看作向量的衍生结构
4.2 矩阵(matrix)
矩阵是二维的向量,所有元素类型相同
S1 S2 S3 S4
TP53 8.5 12.3 6.7 15.2
KRAS 5.2 7.8 9.1 6.5
BRCA1 3.1 4.5 8.2 7.94.2 矩阵(matrix)
4.3 列表(list)
列表像一列火车,每节车厢可以装不同类型的数据
4.3 列表(list)
4.4 数据框(data.frame)
数据框 = 等长向量组成的列表,类似Excel表格,生物信息学最常用数据结构
    id age gender stage tp53_expr
1 P001  45      M    II       8.5
2 P002  52      F   III      12.3
3 P003  38      F     I       6.7
4 P004  61      M    IV      15.2
5 P005  29      F    II       9.1
4.5 数据框操作
4.5 数据框操作
4.5 数据框操作
第5部分:运算符与向量运算
5.1 算术运算符
5.2 循环补齐原则
两个向量长度不等时,短向量会循环补齐至长向量的长度
5.2 循环补齐原则
5.3 关系运算符
5.3 关系运算符
5.4 逻辑运算符
5.4 逻辑运算符
5.5 特殊值
R中有四种特殊值,在数据分析中需要特别注意
5.5 特殊值
5.6 其他运算符
[1] TRUE FALSE FALSE[1] 5 4 3 2 1第6部分:R编程
6.1 if 语句
6.1 if 语句
6.2 for 循环
对序列(向量)中的元素依次进行处理
6.2 for 循环
6.3 while 和 repeat 循环
迭代次数: 7 第7部分:函数及应用
7.1 内置函数
R的强大就在于丰富的内置函数,与数学函数 y = f(x) 概念一致
7.1 内置函数
7.2 向量化函数 vs 汇总函数
| 类型 | 输入 | 输出 | 示例 |
|---|---|---|---|
| 向量化函数 | 向量(n个元素) | 向量(n个元素) | sqrt(), log2() |
| 汇总函数 | 向量(n个元素) | 标量(1个元素) | mean(), sum() |
| 其他 | 向量 | 不等长向量 | unique(), table() |
7.2 向量化函数 vs 汇总函数
7.3 自定义函数
减少代码重复,提升编程效率
7.3 自定义函数
7.4 使用三方包函数
获取帮助
第8部分:取子集
8.1 子集选取概述
从对象中提取部分数据,是数据分析的基本操作
| 操作符 | 适用对象 | 说明 |
|---|---|---|
[ |
全部 | 返回同类型子集 |
[[ |
列表/数据框 | 返回单个元素 |
$ |
列表/数据框 | 按名字访问元素 |
8.2 向量取子集
8.2 向量取子集
8.3 矩阵取子集
8.3 矩阵取子集
8.4 列表与数据框取子集
8.4 列表与数据框取子集
    id age gender stage tp53_expr
1 P001  45      M    II       8.5
2 P002  52      F   III      12.3
3 P003 38 F I 6.7 id age stage
1 P001 45 II
2 P002 52 III
3 P003 38 I
4 P004 61 IV
5 P005 29 II id age gender stage tp53_expr
2 P002 52 F III 12.3
4 P004 61 M IV 15.2[1] "P004"课程总结
本讲要点回顾
数据结构
- vector:最基础,元素类型统一
- matrix:二维向量,同类型
- list:灵活容器,类型混合
- data.frame:等长向量列表,最常用
向量类型
- numeric (double/integer)
- character, logical, factor
- 强制转换规则
编程要素
- 赋值
<-,命名规范 - 运算符:算术、关系、逻辑
- 特殊值:
NA,NaN,Inf,NULL - 循环:
for,while,repeat - 条件:
if/else,ifelse()
函数与取子集
- 内置函数:向量化 vs 汇总
- 自定义函数
- 取子集:
[,[[,$
课程作业
使用 R Markdown 生成报告并打印提交
任务
- 自定义函数,根据方差公式写出方差计算函数,与
var()对比 - 自定义函数,根据身高
height(cm)和体重weight(kg)计算 BMI \[BMI = \frac{weight}{(height/100)^2}\] - 自定义函数,对向量
x和阈值threshold(默认60),计算所有大于阈值元素的均值
参考资料
📖 王敏杰,《数据科学中的R语言》
https://bookdown.org/wangminjie/R4DS/⚡ Hadley Wickham,R for Data Science(第2版)
📋 Posit R Cheatsheets(速查表)
https://posit.co/resources/cheatsheets/
下节预告
我们将学习
- 📝 Markdown 基础语法
- 📊 R Markdown 文档结构
- ⚙️ 代码块选项与输出控制
- 🌐 Quarto 现代工作流
- ♻️ 可重复性研究最佳实践
Questions?
王诗翔 副教授
中南大学生物医学信息系
📧 wangshx@csu.edu.cn
🐙 https://github.com/WangLabCSU
谢谢!
![]()
R语言基础 | 中南大学